


LinkedIn Ads benchmarks for 2023
Discussing the HubSpot Marketing Dashboard - particularly the reports and functionality it offers.
Sherlock Holmes, Sir Arthur Conan Doyle’s iconic character, once said (apparently): “It is a capital mistake to theorize before one has data”, and I most certainly agree with him.
In marketing, you can’t make data-driven decisions on where to spend your budget to increase your return on investment (ROI) without that one important thing – data.
Thankfully, HubSpot’s Marketing Dashboard makes it easy for you to see your data, presenting it in a simple and digestible format.
But what is your HubSpot Marketing Dashboard and how can you set it up in the best possible way for you and your organisation? Let’s find out.
As a HubSpot marketing user, when you log into your HubSpot portal you are taken to a HubSpot Marketing Dashboard. It can display all the information you need to assess your marketing activities – but you need to set it up first, including what you want to report on.
For example:
What KPIs would you like to measure?
What metrics are of interest to your board?
What is your goal for the quarter/year?
Of course, the HubSpot Marketing Dashboard does come with some reports already set up for you, so going through those is probably the best place to start. Remember, don’t report for the sake of reporting!
Here are the reports you get by default:
This shows the total number of sessions on your website, how many contacts have been generated, and how many customers were generated within the specified date range (this month to date by default). You can change the date range to make this report more valuable for you and your team.
This report can help you to see your visitor-to-new-contact ratio (with Inbound Marketing you should be aiming for between 2 and 5%). You can also use it to show your board how your marketing campaigns are increasing traffic to your website and generating new contacts (and hopefully leads!) in your HubSpot portal.
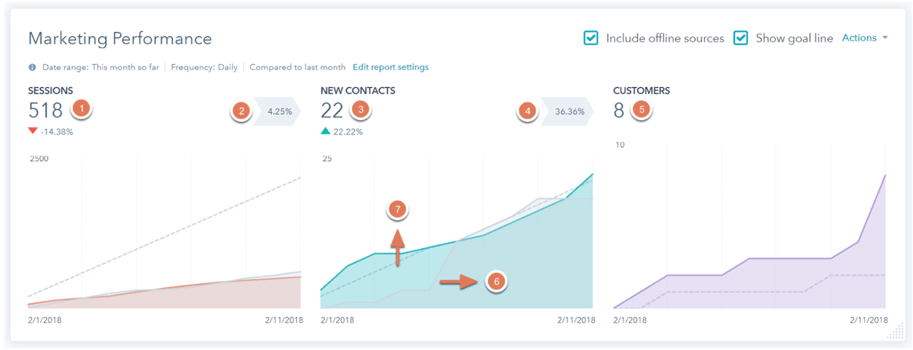
1. This is the number of sessions during your selected time frame
2. This is the conversion rate of sessions to contacts
3. This is the number of new contacts generated during your selected time frame
4. This is the conversion rate of contacts to customers.
5. This is the number of customers who were created during your selected time frame
6. This is a comparison line of your selected time frame to the previous time frame
7. This is the goal line (and will of course only display if you’ve set goals)
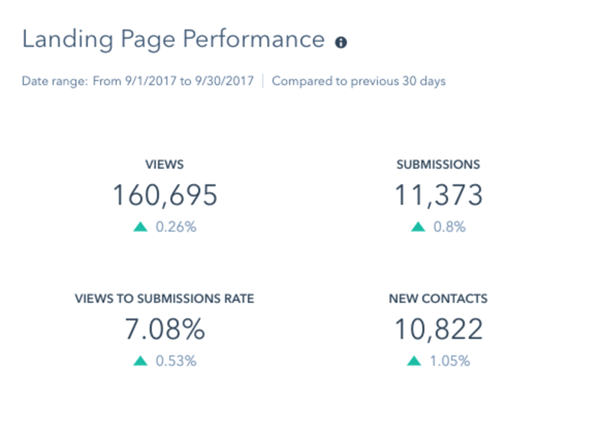
This report does exactly what it says it does: it shows you how your landing pages are performing (including views, submissions, view-to-submission rate, and a number of new contacts generated).
Keep this in mind: thank you page views will also be added to the total views field. OK, so you have all of this landing page information, but what conversion rate exactly should you be aiming for? Our blog on Landing Page Conversion Rates will help.
This report displays your top five landing pages (within the date range selected), in terms of views.
This report shows the overall number of blog views, accelerated mobile page (AMP) views, bounce rate and the number of subscribers your blog has (if your blog is in HubSpot).
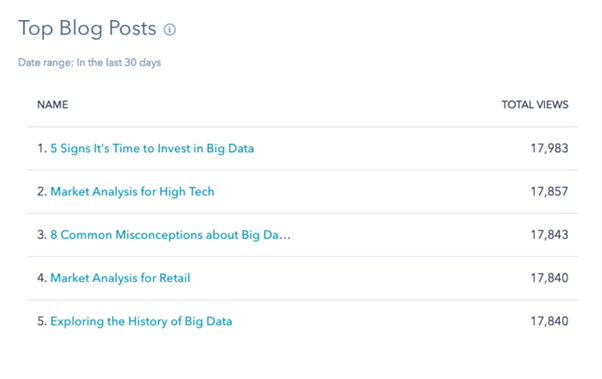
This shows the top five most-viewed blog posts (within the date range selected).
This report shows the number of emails that have been set, opened, clicked, and the overall click rate. Important to note – this does not include automated emails.
This shows your five top-performing emails during the selected date range, based on open rate.
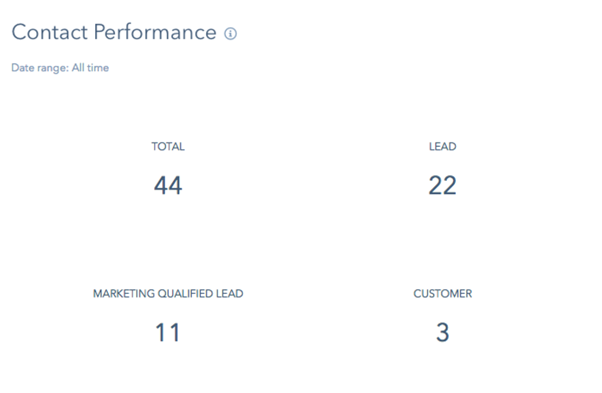
This shows the number of new contacts, leads, MQLs and customers in the selected date range (other lifecycle stages won’t appear in this report).
Important to note – contacts appear in the lifecycle stage numbers for the date range in which they first converted. What this means is that if a contact was created last year and became an MQL this year, they would be accounted for in the MQL number for last year.
This report breaks down contacts created within the selected date range by persona. It enables you to see which personas your contacts have been assigned to or which persona they have self-identified as (if you have persona qualifying form questions).
If you haven’t yet created any buyer personas, or if you’re not even sure where to start, you should probably read our blog – What is a Buyer Persona.
If not, talk to your team and industry stakeholders about what it is that you need to monitor and report on in order to show the ROI of your marketing activity.
There are many reports in HubSpot (check out the link below) and you can also create your own custom reports (if you have the reporting add-on) to show pretty much anything.
However, there is a limit of 10 reports per dashboard. If you are a HubSpot Professional, Enterprise, or Reporting add-on user, you can customise the reports on the dashboard to your liking.
You can find out more about these HubSpot Marketing Default Reports here.
If you want to make your HubSpot Dashboards work for you, remember to customise them (if you have the HubSpot Reporting add-on) so that they show you the KPIs and metrics that matter to you and your business]
**All the screenshots of reports in this blog are taken from HubSpot’s blog on Marketing Default Reports.
Want to find out more about using the reporting add-on? Request a demo of HubSpot’s Reporting add-on here.
.png)
Your website is your most valuable sales and marketing tool, so it needs to be as optimised as it can be. Uncover opportunities to boost your rankings with a free SEO audit.